Yesterday I spent a lot of time on the p-curve for the S3 system. Today, I think I have solved it. Here be a lot of RPG dice maths and some pretty graphs.
Warning: If you thought that the last one had a lot of maths, you ain’t seen nothing yet.
Yesterday’s attempt to fix the p-curve for S3 resulted in my wondering if my maths was right. It turns out my instinct was correct and there was a fault.
Full credit for this fix goes to user owen88 at the maths Stack Exchange. There it was pointed out to me that the probability space followed a binomial distribution (something I should have remembered). Also, owen88 came up with this beauty.

That was not owen88’s only contribution to the discussion. Despite my confusing miscommunication at one point owen88 produced about the prettiest looking graph I’ve seen for these values and observed that sets of probabilities grouped closely together. That observation would prove vital later on.
Fixing the maths for the p-curve for the S3 system
In my last post, I had been fairly sure that my maths for CL=1 was right. It turns out that I was spot on for CL1. However, CL>1 was a dog’s dinner.
All was not lost because (after doing the maths by hand on paper to check) the CL=1 maths acted as a guide to my getting the rest right. After struggling to remember how to do advanced stuff like probability on a spreadsheet, I asked a question on Super User. That question got no answer and I was stumped for a while. Then I woke up at 5 am with an idea.
My idea panned out and I entered this into the spreadsheet:
=BINOMDIST((C$2-$A4),C$2,1-((7-$B4)/6),1)
That’s owen88’s equation in the BINOMDIST function. It was the C$2-$A4 part that I needed to fix which shows the exponent of the second set of brackets.
The true p-curve for the S3 system, at last
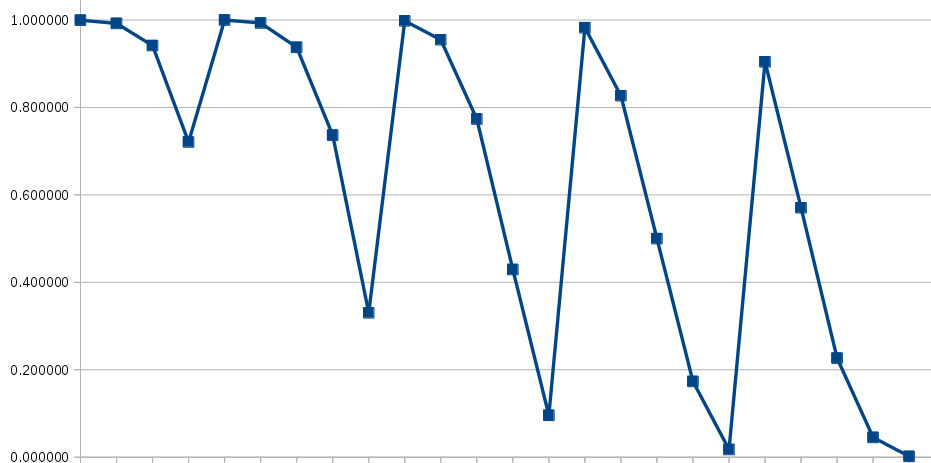
This shows the p-curve for S3 on 7d6 but without CL1/DR2 which I missed off for some reason.
The significant difference here is that peaks and troughs are more pronounced and the sets trend slightly towards zero.
Probability charted with CL and DR
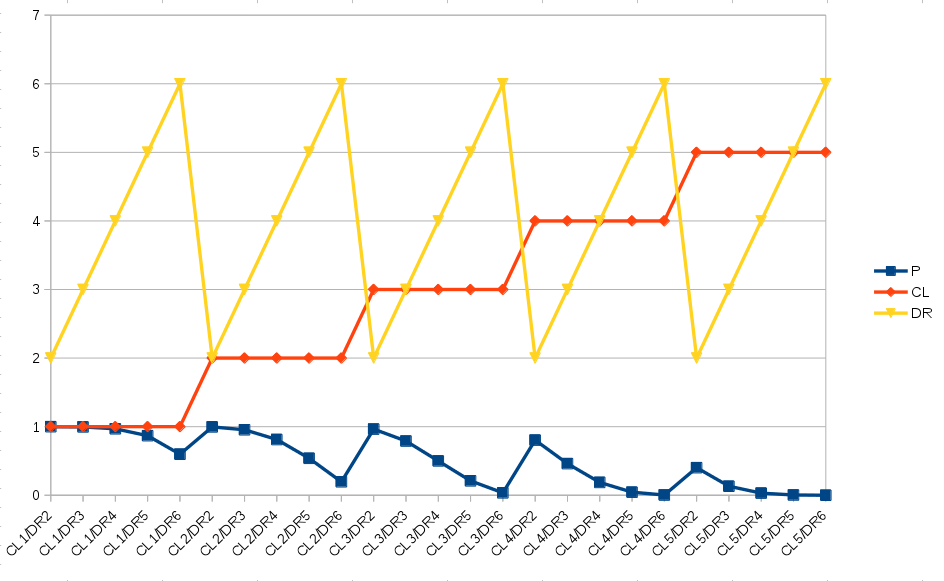
Looking a bit like a London Underground map, we can see that DR does add difficulty to the graph and faster than CL does. CL just has the ability to add constraints outside of the total dice count of a player.
Charted with the probability in descending order looks like this:
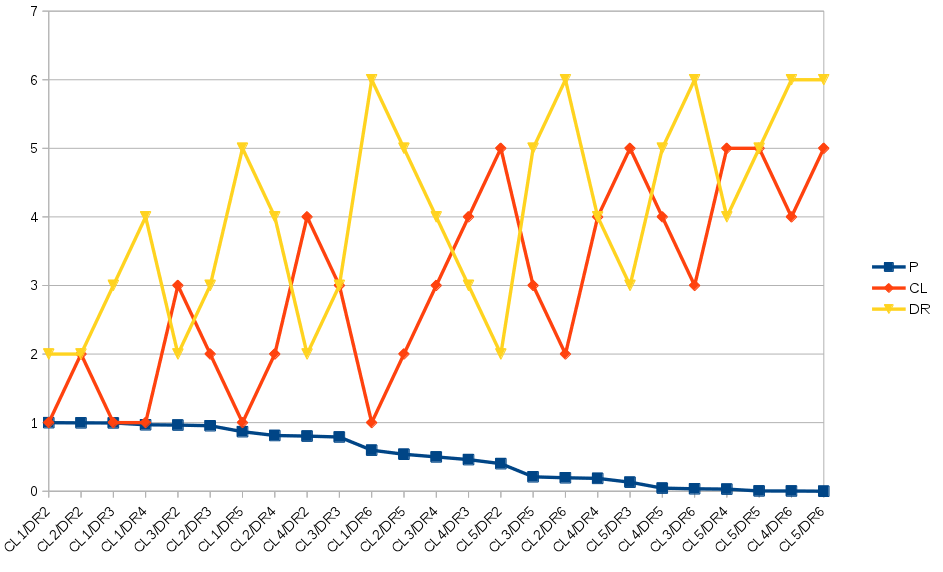
What you can see is that CL and DR move inversely to each other as the P value trends downwards. I did not see that at the time (although it is obvious now).
Paired probability in the p-curve for the S3 system
My breakthrough moment came when I wondered if I could find matching probabilities. I had noticed that on each curve for CL the data point for DR seemed to land at about the same place as one lower DR for the next CL. To try and help me find these pairs I summed CL and DR. I used the 5d6 column for this chart.
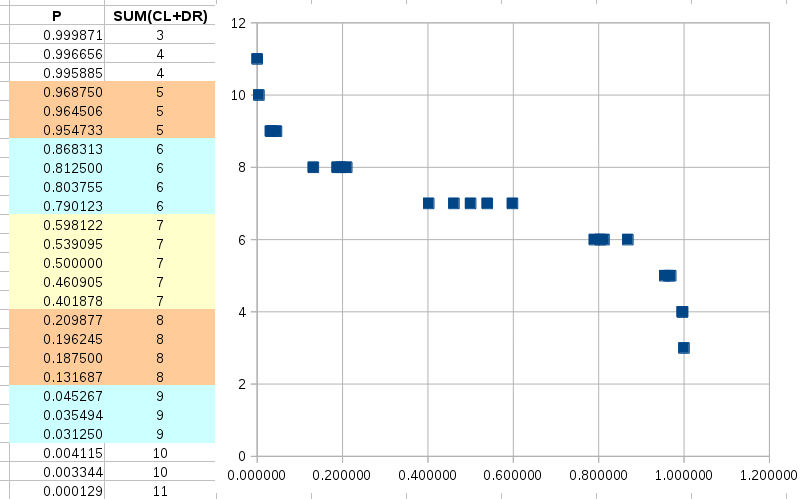
That was when I saw that the probabilities had ordered such that the sum of CL and DR increased as the probability decreased. Furthermore, where the sum was similar the probabilities were pretty close. In many cases, the effective odds of rolls had close to negligible differences. Rolling one six was not that much easier than rolling two fives or sixes. There is a difference of a few percent in each grouping.
It seems that the probability of success falls along an S-curve for the sum of CL and DR.
Now, that is something I can work with. It still means reworking the adding CL/DR rules but nothing else is broken.
Something else of interest is that the number of dice changes very little other than the areas where tasks are easy and hard in the curvey bits of the S (the extremes). Here is the same chart for 7d6.
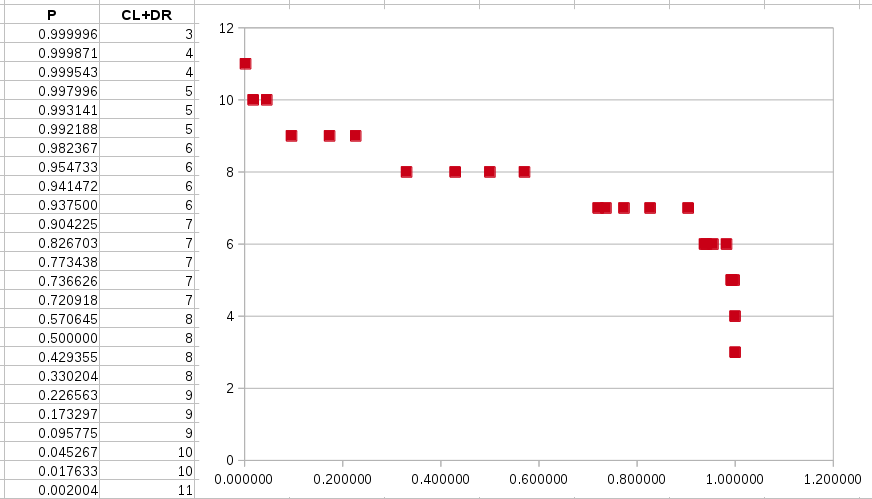
You may notice that the probability stays at above 0.8 right up until the end of CL+DR=8 where after the difficulty starts to fall away. Also notable is that the central sets are always more widely distributed on the probability scale while the high and low ends cluster together quite tightly.
Pleasing distribution of the p-curve for the S3 system
I can’t help but find this distribution quite pleasing. It means that dice counts matter for players while the differences in CL and DR still have meaning where there is a reasonable degree of challenge.
Now I understand the p-curve for the S3 system, I know how to edit the CL/DR stats in the source material to create a tighter and more consistent gaming experience.
This also allows for subtle bonuses where CL drops but DR rises and the overall odds shift a little bit. For the player, I imagine this will be psychologically more enticing while not changing the overall probability by very much.
My profound thanks go out to owen88 for helping me navigate this investigation.
Caveat at high dice counts
Just before I hit publish, I figured I would chart an extreme dice situation. In theory, a player could have 16 dice to roll. Some would be D4 and some D8s. However, to keep it simple I modelled on just 16 six-sided dice. Things get wild at those high values. The groupings by CL+DR break down as the p-range spreads out in the middle and overlap each other.
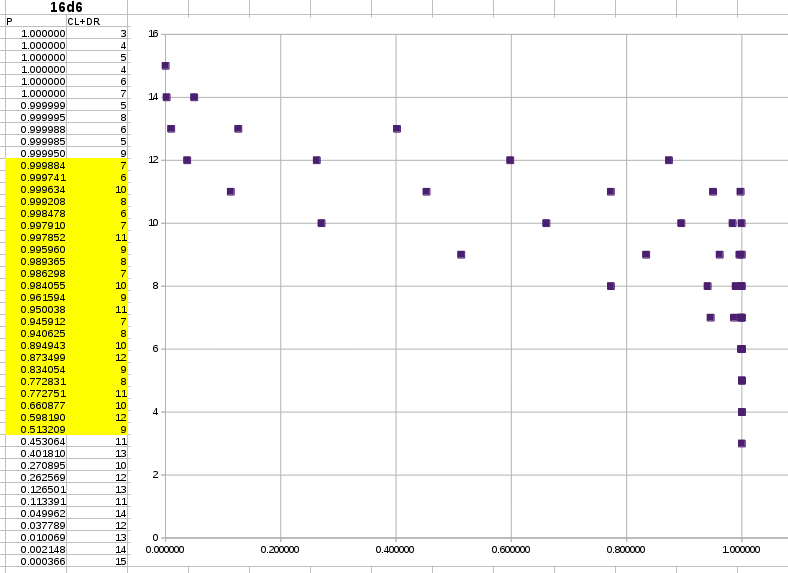
This chart includes up to CL=9. Under S3 the theoretical limit for CL is 8 which is considered an impossible task. Also, no player gets a bonus of 8 dice from the transferable skills pool so 16 dice is never actually going to be a thing. This was purely me being curious.
What this tells me is that at lower dice counts the probabilities for rolls should clump up more for the sum of CL and DR. That’s good. However, at high-end difficulty CL/DR will have to be manipulated with care. Otherwise, an increase in difficulty could make things easier.
That’s all I’ve got for now. I’ll get back to you with an update when I have worked out how to apply this new learning to the existing S3 game machanics.


Pingback: The Story Skills System (S3) explained • Matthew D Brown
Pingback: Why we use the inverse square law in game design • Matthew D Brown